2.42.3.1.4 The Analyze Mixure Design Dialog Box
Contents
Supported Information
To open the Analyze Design dialog
- Activate a worksheet with your experimental design data which is generated via Generate Design or Define Custom Design
- Select Statistics: Quality Improvement: Design of Experiment from the Origin menu
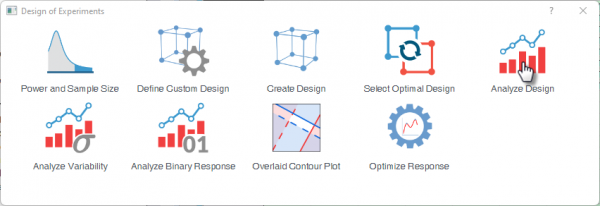
- Select the Analyze Design icon
 | Topics for Further Reading:
|
Model
| Response | Select the column containing the measured outcome variable. |
|---|---|
| Model Terms | Specify which effects to include in the fitted model. Click the + button to open a dialog to select model terms
In the opened dialog, you can choose from the term list below, add or remove the terms from the right panel, and click the OK button to define the model.
|
| Include Blocks in the Model | Toggle whether block terms are included as fixed effects in the regression model. |
| Analyze Components in | Specifies how mixture components are represented in the model:
|
Stepwise
Perform stepwise regression to identify the best subset of the model. Four selection methods are available. Please refer to the Stepwise Regression for Analyze Design page for more details
| Method | Select the stepwise regression methods
|
|---|---|
| Alpha to Add | The significance threshold for adding a term to the model. A candidate term enters the model only if its p-value is below this threshold. |
| Alpha to Remove | The significance threshold for removing a term already in the model. A term is removed if its p-value exceeds this threshold. |
| Show Model Selection Details | Displays the step-by-step log of the selection process in the output. |
Quantities
Select which numerical results are reported after fitting the model. Refer to the interpreting results page for details of the statistics
| Coefficients Table | Selects the statistics displayed for each model term. Refer to the interpreting results page for details of the statistics
|
|---|---|
| Confidence Level (%) | Sets the confidence level for the interval estimates (default is 95%). A higher level produces wider intervals but greater confidence that the true value is captured. |
| Regression Equation | When enabled, outputs the fitted regression equation. This lets you predict the response by plugging in factor values. |
| ANOVA Table | When enabled, displays the Analysis of Variance table, which partitions the total variation into model, residual, and lack-of-fit components. It provides the overall F-test and p-value to assess whether the model explains a significant portion of the variation. |
| Fit Statistics | These metrics summarize how well the model fits the data. Refer to the interpreting results page for details of the fit statistics
|
Diagnotics
The Diagnostics tab controls which residual and fitted-value outputs are generated for checking model assumptions and spotting unusual observations.
Refer to the diagnotics section in the interpreting results page for details of the fitted results and residuals
| Fitted Values | When enabled, reports the predicted response value for each run based on the fitted model. These are the values the model expects, used to compare against actual observations. |
|---|---|
| Residuals | Select which type of residual values to be output
|
Prediction
The Prediction tab controls whether to generate the prediction worksheet for calculating response values and their associated uncertainty intervals from specified factor values.
Refer to the Model Prediction - Find Y from X page for details on the generated worksheet.
| Find Y from X | Toggles the prediction calculation on or off. When enabled, a worksheet named DOEFindYfromX is generated. In the worksheet, enter factor values into the respective columns, the predicted response (Y) are calculated automatically. |
|---|---|
| 95% Confidence Limits for Predicted Y | When checked, the report includes the 95% confidence interval for the mean response at each set of factor levels |
| 95% Prediction Limits for Predicted Y | When checked, the report includes the 95% prediction interval for an individual future observation. |
Plots
The Plots tab lets you select which diagnostic and exploratory graphs to generate from the fitted model.
| Plots | Select the plots to generate from the fitted model. Refer to the Plots in DOE page for details of the plots
|
|---|---|
| Residual Type | Choose the residual type to be used for the residual plot. Refer to the diagnotics section in the interpreting results page for details of the residuals
|
| Settings of Contour and Surface Plot | Available only if Contour Plot or Surface Plot is selectedf from the Plots control
The section enables you to select which two continuous factors to be used as X/Y axes and define the specific operating conditions for the contour or surface slice
|
Dialog Theme
Save and load the settings of the dialog. Use this to store frequently used factor configurations, design options, or output preferences, then recall them for future designs without re-entering all values.