2.42.4.2 Analyze Binary Response
Contents
Introduction
Analyze Binary Response is the dedicated tool for DOE when your outcome has only two levels (pass/fail, defect/no defect, yes/no)
Use this analysis after creating or defining a design and collecting binary outcome data. Supported design types:
- Factorial designs (2-level, general full factorial, Plackett-Burman)
- Response surface designs (central composite, Box-Behnken)
- Definitive screening designs
Binary response data
Binary response data must be organized into two worksheet columns
Number of events Number of trials 45 (success or failure) 50 (total tested) 38 (success or failure) 50 (total tested)
- One column counts the events(success or failure); the other counts the total trials.
Processing
- Activate the worksheet containing your experimental design data (generated via Generate Design or Define Custom Design).
- Enter response data in event/trial format
- Select Statistics: Quality Improvement: Design of Experiment from the Origin menu
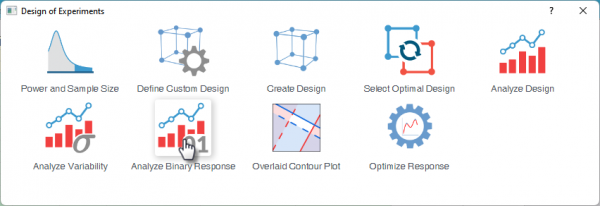
- Click the Analyze Binary Response icon
Run the Analysis
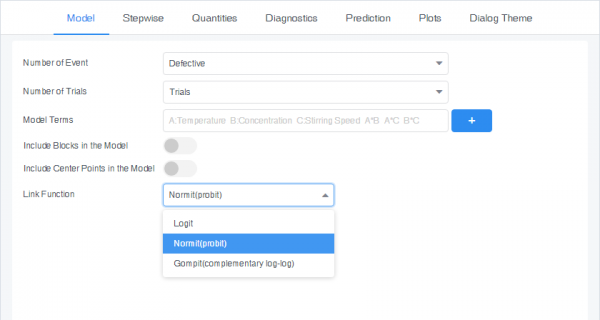
- In the Model tab of the dialog, specify the Number of events column, and Number of trials column.
- Select a Link Function
- Logit: \(\ln\left(\frac{p}{1-p}\right)\)
- Normit (probit): \(\Phi^{-1}(p)\)
- Gompit: \(\ln\!\bigl(-\ln(1-p)\bigr) \)
The remaining options in the analysis dialog depend on the design type. See the corresponding dialog help:
Results of Analyzing Binary Response
Binary response analysis uses deviance (rather than standard sum-of-squares) to measure model fit, which introduces slight differences from standard design analysis. The output tables are otherwise largely similar, with the following exceptions.
For detailed guidance on interpreting results, see Interpreting DOE Results
Coefficients Table
- z-value: The Wald test statistic, calculated as the estimated coefficient divided by its standard error. It tests whether the coefficient differs significantly from zero.
- Prob > |z|:The p-value of the Wald test. Values below the significance threshold (typically 0.05) indicate statistically significant terms
Model Statistics
- Deviance R-Sq: Measures model fit, analogous to R-Square. Higher values indicate better fit
- Deviance R-Sq (adj): Adjusted measure of model fit, analogous to Adj. R-Square. Higher is better. In regression, Deviance R-Sq always rises when you add terms. Deviance R-Sq (adj) does not — it can decrease if you add terms that do not meaningfully improve the model. Deviance R-Sq (adj)is preferred when comparing models that have different numbers of terms
- AIC: Akaike Information Criterion.It evaluates model fit while penalizing model complexity. When comparing models fitted to the same data, a smaller AIC generally indicates a better balance between fit and complexity.
- AICc: Adjusts AIC for small sample sizes. As with AIC, smaller values indicate a preferable model when comparing models fitted to the same data
- BIC: Bayesian Information Criterion. Like AIC, BIC balances model fit and complexity, but applies a stronger penalty for additional model terms. A smaller BIC generally indicates a better model when comparing competing models.
ANOVA
- Deviance: The reduction in model deviance attributable to the term. Larger values indicate that the term explains more variation in the log-odds.
- Mean Deviance: Deviance divided by degrees of freedom (DF). When DF = 1, it equals the Deviance.