1.1 3D Polar Plot for Antenna Radiation Pattern
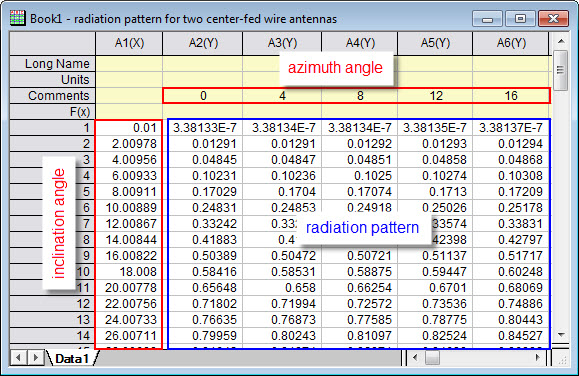
The aim of this app, 3D Polar Plot for Antenna Radiation Pattern is to provide an easy way to plot 3D polar antenna radiation pattern. A radiation pattern defines the variation of the power radiated by an antenna as a function of the direction away from the antenna. Direction away from the antenna can be described by two angles: Elevation/Inclination and Azimuth. The radiation pattern data can be represented by a virtual matrix in Origin: the value of one angle is laid along the first column of the worksheet, the other angle is laid along the first row or column label row. For angle in the i-th row of the first column and angle in the j-th column of the first row(or column label row), the radiation pattern value in the direction defined by these two angles is put into the cell located at the i-th row and j-th column.
Examples
The following is a simple example to show you how to create an antenna radiation pattern graph from a virtual matrix.
- Create a new workbook, fill your data in the worksheet in the format suggested by the graph below.
- Click the icon
 from Apps panel to bring up the plotresp X-Function dialog, make settings as suggested by the graph below.
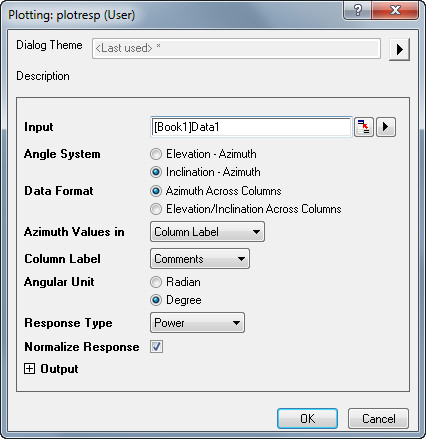
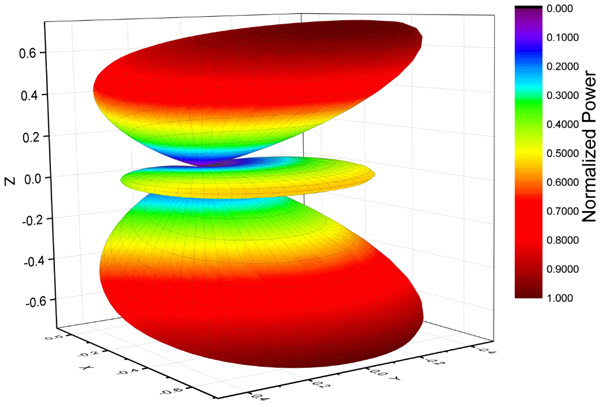
- Click OK, a graph will show. Rotate it to get the graph below.
You should make different settings in the plotresp X-Function dialog according to the type of your data and how you fill it in the worksheet. You can also change parameter by clicking green lock in the result matrix. Details of the options in the dialog are explained below.
Dialog Controls of the plotresp X-Function Dialog
| Input | Specify the radiation pattern for plotting. You can simply select the whole worksheet. |
|---|---|
| Angle System | Specify the coordinate system used to describe the radiation pattern. Available options include:
|
| Data Format | Specify which way to set the Azimuth angle values and Elevation/Inclination angle values for the graph. Available options include:
|
| Azimuth Values in(or Elevation Values in or Inclination Values in) | Specify where the Azimuth (or Elevation/Inclination) angle values are. The following options are available when Azimuth Across Columns (or Elevation/Inclination Across Columns) has been selected for Data Format.
|
| Column Label | This is available only when Column Label has been selected from the Azimuth Values in, Elevation Value in or Inclination Values in drop-down list. It allows you to use the values in the Long Name, Units or Comments row as Azimuth, Elevation or Inclination angle values. |
| Angular Unit | Specify unit of the input angle. Available options include:
|
| Response Type | Specify type of radiation pattern. Available options include:
|
| Normalize Response | Specify whether the input pattern should be normalized before further processing. Assume maxResponse is the maximum response value.
|
| dB Range | Adjust response dynamic range according to the specified value. This option is available when dB has been selected in Response Type. |
| Output | This includes four result matrix objects: x, y, z and response. They should be in the same matrixsheet. You can simply keep the default setting. |