Hinweis:Dieser Abschnitt ist nur in englischer Sprache verfügbar. Wir bitten um Ihr Verständnis.
2.30 3D Convex Hull
Summary
The 3D Convex Hull app is used to calculate the convex hull envelope (boundary) for a given set of XYZ scatter points.
Tutorial
In this tutorial, we will generate a set of random data points and use 3D Convex Hull app to plot the convex hull envelope and output its volume and area.
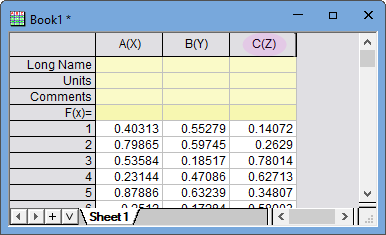
- Start from a new project. With the empty worksheet active, click Add New Column button
 on the Standard toolbar to add a third column. Click on this new column and select Set as Z button
  from the popped-up mini toolbar.
- Highlight all 3 columns and click button
 on the Standard toolbar to set column values with uniform random numbers. Now we have a set of XYZ data.
- Highlight all 3 columns and select menu Plot > 3D: 3D Scatter to plot a 3D Scatter graph.
- With the graph active, click 3D Convex Hull app icon
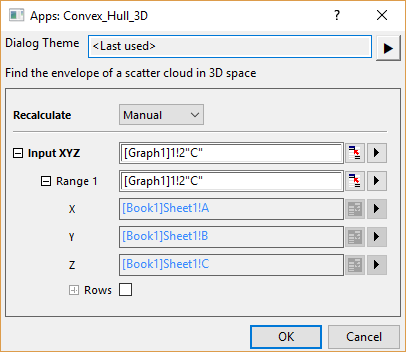
 from App Gallery. A Convex_Hull_3D dialog will open. The 3D Scatter is auto-picked as Input XYZ.
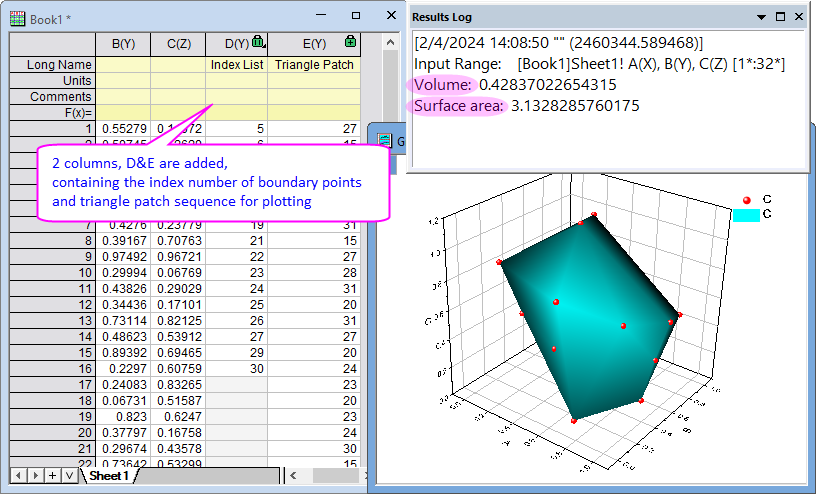
- Click OK button to plot the convex hull as a 3D Surface onto the source graph directly. And the calculated Volume and Surface Area will be output to Results Log.