1.16 2D Confidence Ellipse (Pro)
Summary
The 2D Confidence Ellipse app can be used to add confidence ellipse to 2D scatter plot
Tutorial
- Start this tutorial with the app 2D Confidence Ellipse installed. If you have not installed this app, please click Add Apps button in Apps Gallery to open App Center to search and install the app.
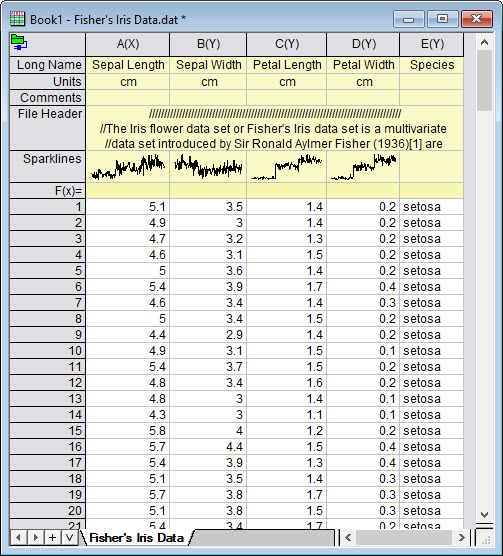
- New a worksheet, click Data > Connect to File : Text/CSV to import the sample file <Origin Porgram Folder>\Samples\Statistics\Fisher's Iris Data.dat
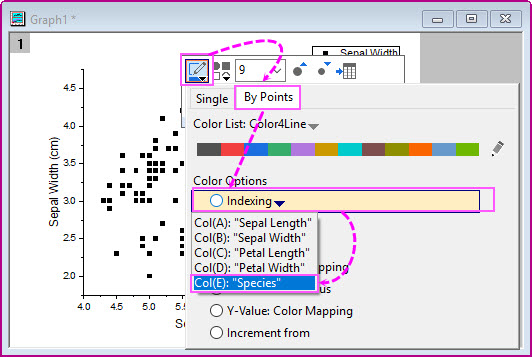
- Highlight col(A) and col(B) to plot a scatter graph. Click on the scatter plot, within the popup mini toolbar, click Symbol Edge Color button to set the color of symbols to 'By Points and index to Col(E).
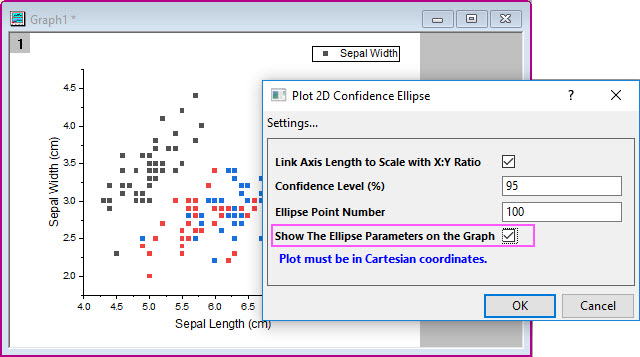
- With the graph activated, click the app icon 2D Confidence Ellipse to open the app dialog. Check the check box Show The Ellipse Parameters on the Graph to show the parameters on the graph.
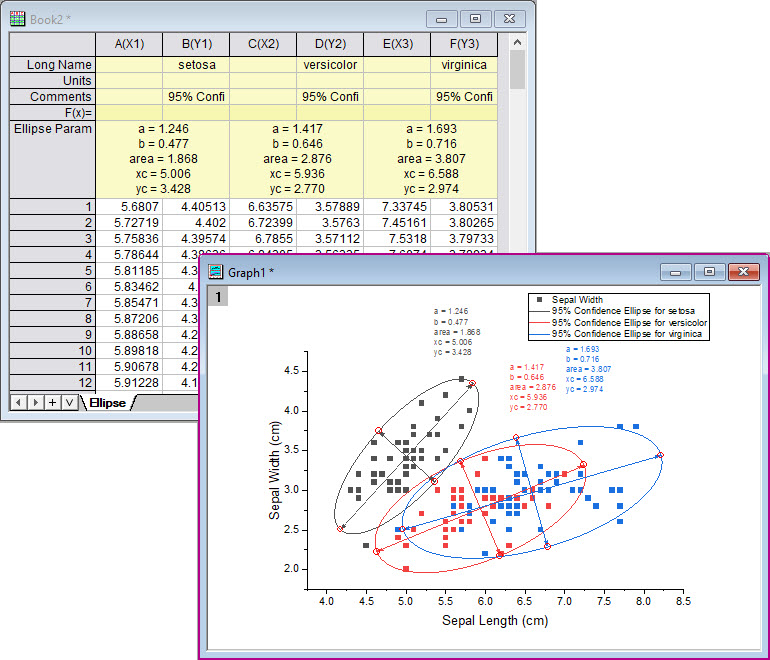
- Click OK button to create the ellipses for these three groups of the scatter points.