Last Update: 7/12/2018
There are multiple ways to do this depending upon the size of the blocks of data.
You can hold the CTRL key and make multiple range selections within a single column and then plot them.
Note: If the data is large, it can be tedious.
If there are some pattern in data, you can consider use Worksheet Query dialog to set condition to select multi-blocks of data and then plot. E.g. if data is separated by a row with with missing values, you can use the following method:
When the desired data is selected, you can then plot it directly, for example make a box chart plot:

Note: You can also choose to mask, extract selected data or access more advanced functions in Worksheet Query. |
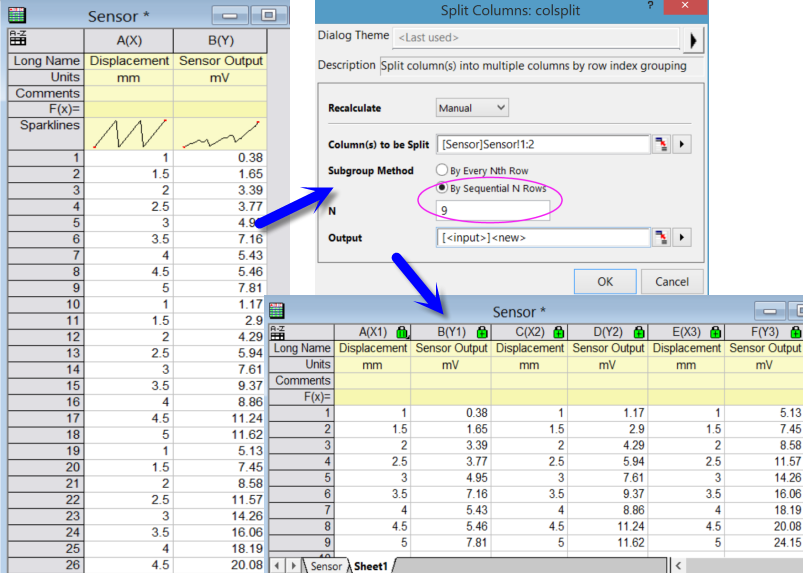
In Origin 2016 and newer versions, If you want to plot every N rows, or every Nth row, you can highlight the XY column and select Worksheet: Split Columns menu to first split the data into multiple columns. then plot them.
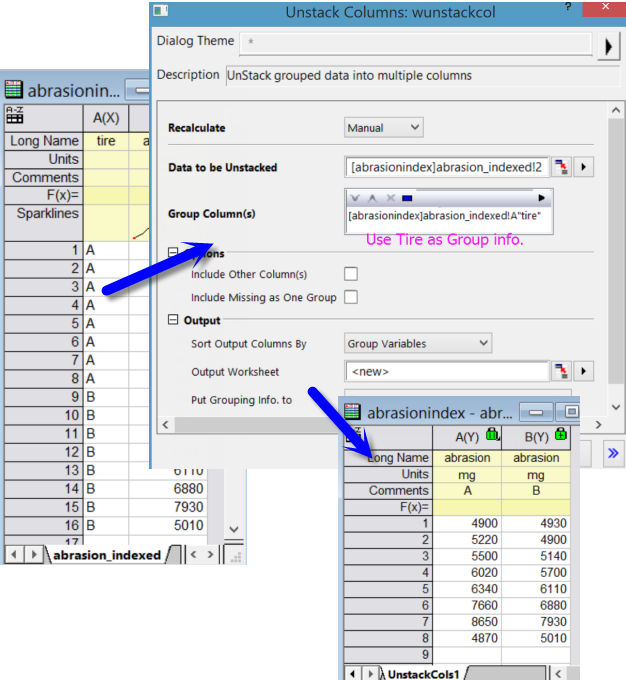
If you want to plot data based on group information on other columns, you can first unstack the data and then plot.
Keywords:Extract, Mask, Select, Multiple Blocks, Multiple Subranges, split, unstack