
|
Example
In this tutorial we will a 2D function ") and make a contour plot from it. and make a contour plot from it.
=\sqrt{u}+x+y\\
u(\mathbf{x},\mathbf{y})=x^2+y^2
\end{matrix}\right.")
while ![\mathbf{x}=\mathbf{y}=[0,0.1,0.2,0.3...,10]](/quick-help/en/images/How_to_create_a_2D_nested_function_plot/math-128ba546eb7330a6f6d67bab04195e10.png?v=0 "\mathbf{x}=\mathbf{y}=[0,0.1,0.2,0.3...,10]")
Steps:
- Click the New Matrix button
 to create a new matrix. to create a new matrix.
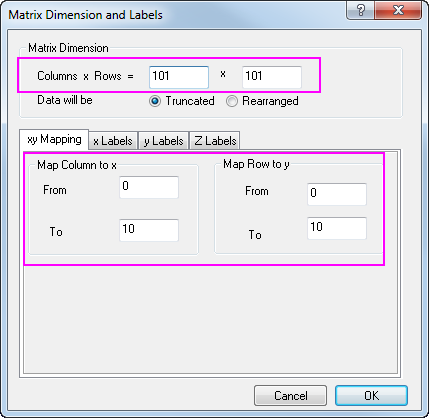
- To set the dimensions, select Matrix: Set Dimension/Labels from Origin menu menu, and set values as the image below, then click OK to apply:
- Then we are going to set values for the active matrix object to make it be
=x^2+y^2")
- Select Matrix: Set Values from Origin menu. You can set values for Mat(1) in the opened dialog
x^2+y^2
- Now add an extra matrix object to act as
=\sqrt{u}+x+y") , which will call Mat(1) in calculation. , which will call Mat(1) in calculation.
- Click the D button,
 in the upper-left corner of matrix and choose Add from the context menu in the upper-left corner of matrix and choose Add from the context menu
- Click the D button, again and choose 2 to active the 2nd matrix object.
- While the 2nd matrix object is active, set values for Mat(2) using formula below:
sqrt(Mat(1))+x+y
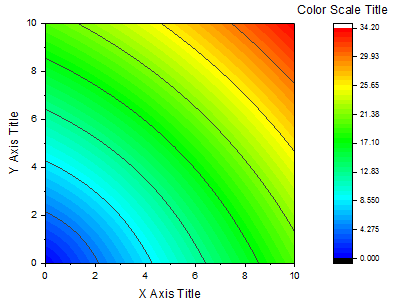
- Finally, we can plot a contour graph from the Mat(2), which will be similar to this one:
|
=\sigma(u(\mathbf{x},\mathbf{y}),\mathbf{x},\mathbf{y})")