Last Update: 9/10/2019
Use Add Grid Lines button
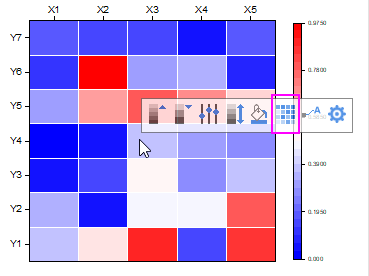
If you create a Heatmap from categorical XY values, you will find the Add Grid Lines button ![]() when you click any cell on the Heatmap. You can click this button to add borders for each cell.
when you click any cell on the Heatmap. You can click this button to add borders for each cell.
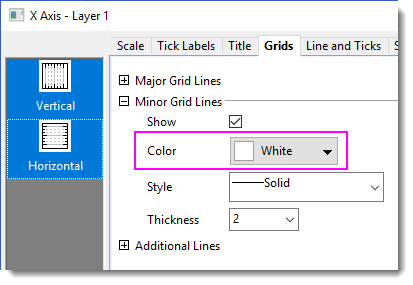
To further customize the border color and style, double click on the axis to open Axis dialog. Go to the Grid tab and change Minor Grid Lines, Color, Style and Thickness as needed.
Add grid lines manually
Note that the Add Grid Lines button is available only when the Increment of both Major and Minor Tick of X and Y axis is set to “1”. If the button is not available on your Heatmap, you can


Use spacing as cell border
Another way to add border is adding gaps between cells.


If you plot a Heatmap from a virtual matrix, you can add custom tick labels as follow

| Note:
Please do not use Column Name or Label type and put your custom label text in the column label row in the source worksheet. For a graph from virtual matrix, it cannot refer to the source worksheet. |
Keywords:heatmap, border, grid lines, contour, label, boundary
Minimum Origin Version Required: 2019