3.6 FAQ-226 How do I fit a part of the data plot in my graph?
Fit-Partial-Plot
Last Update: 2/3/2015
You have several options:
- With your graph active, select the Data Selector tool,
 , located on the Tools toolbar. You will see a marker at the beginning of the data plot and one at the end. Click on each marker to move it to the desired begin and end position. As you move the markers, you can read the x,y coordinate values from the Data Display window. When you have each marker positioned, double-click or press Enter to set this range.
- Use the Regional Data Selector tool,
 . With this tool, you can drag-n-drop to select a region on the graph to fit. A pair of data marker appears either to indicate what data will be inputted.
- Open the NLFit dialog, by selecting Analysis: Fitting: Nonlinear Curve Fit. On the Data Selection / Settings tab, the Input Data and Range 1 nodes will have from and to row number values in square brackets. In the example below it is [20:40], which means the fit will be performed on data in this range only.
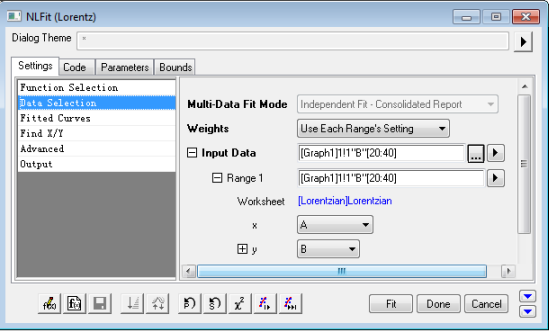
To modify this Range, click the  next to the Range1 node. Choose Select Range from Graph, which will put the data selector markers back into edit mode on your graph for you to position them to new values.
If you have Origin 8.6 or higher version, you can also expand Input Data: Range 1: Rows, and choose By X to specify the range by x values, e.g. type 10 in the From editbox and 45 in the To editbox, and it will choose the range whose x values are between 10 and 45, Range 1 is changed to [Lorentzian]Lorentzian!(A,B)[x10:45].
Keywords:subset, select, range, selector