Last Update: 4/17/2019
Origin2019 and later versions,
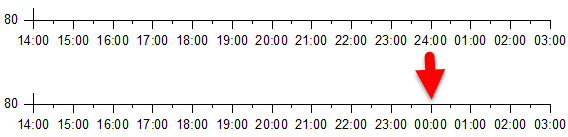
Create a plot from Time data and set Type to Time and Display to HH:mm in the Tick Labels tab > Display sub-tab of the Axis dialog. Tick labels will show 24:00 as 00:00 by default.

Origin2018b and ealier versions,
Set tick label Type as Date and Display to Custom Display in the Tick Labels tab > Display sub-tab of the Axis dialog. Enter HH':'mm in Custom Display.

Keywords:axis, time data, time begin