1.254 FAQ-1047 How to show and customize data points in a box chart?
data-point-box-chart
Last Update: 3/16/2020
To display the binned data in the Box chart
- Double click on the Box chart to open Plot Details dialog.
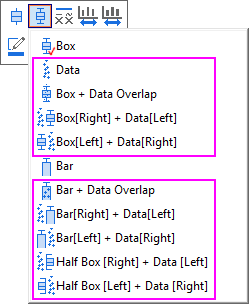
- Go to the Box tab of the dialog, select Data, Box + Data Overlap, Box(Right) + Data(Left), Box(Left) + Data(Right), Bar + Data Overlap, Bar(Right) + Data(Left), Bar(Left) + Data(Right), Half Box(Right) + Data(Left) or Half Box(Left + Data(Right) under the Type drop-down List.
Or
- Click on the Box chart and the Mini Toolbar will display.
- Click on the Box Type button and select the option with data point.
To customize data points in the Box chart
- Double click on the Box chart to open Plot Details dialog.
- Go to Symbol tab to customize data points format.
If the Box chart type is Data, besides the above method, you also can customize data points in Mini Toolbar.
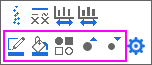
- Click on the Box chart and the Mini Toolbar will display.
- In the Mini Toolbar, you can use Border Color, Fill Color, Plot Symbol, Increase Symbol Size and Reduce Symbol Size buttom to customize data points format.
Keywords: plot, box chart, data point, mini toolbar