1.236 FAQ-1010 How to create an implicit function plot?
create-implict-function-plot
Last Update: 5/16/2019
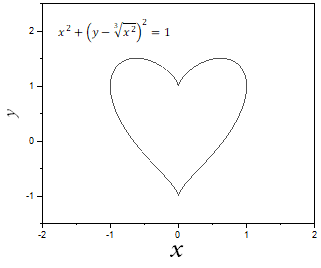
To create a plot of an implicit function, you will need to create an implicit function and then simulate this function. For example, to plot function
![x^2+(y-\sqrt[3]{x^2})^2=1](/quick-help/en/images/How_to_create_an_implicit_function_plot/math-52ba776c218bb759ca54c58a89b507d8.png?v=0 "x^2+(y-\sqrt[3]{x^2})^2=1")
- Create an implicit user-defined function by Tools: Fitting Function Organizer.
- Create a new user-defined function under "User Defined" category.
- Define the function as follow:
- Function Name = Heart
- Function Model = Implicit.
- Variables = x,y
- Function From = Equation
- Function = f=x*x+(y-(x*x)^(1/3))^2-r^2.
Note: You can also refer to function "Circle" under Implicit category for how to define an implicit function.
- Click Save button to save it.
- Click Simulate button to create a plot of this function.
|

|
Keywords:simulate curve, implicit function, function plot, circle function plot, ellipse function plot