1.256 FAQ-1051 How to add a boundary to a contour plot?
add-boundary-contour-plot
Last Update: 3/29/2020
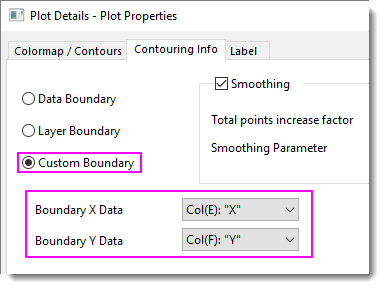
There are several ways you can add a boundary to a contour plot of XYZ worksheet data. There are three options found on the Plot Details Contouring Info tab:
- Double-click on the plot to open Plot Details, then click the Contouring Info tab.
- Custom Boundary: This option is probably the most common. You provide XY columns that define a custom boundary.
- Data Boundary: This option creates a boundary by drawing a convex hull around the data points.
- Layer Boundary: This option creates a boundary that coincides with the Layer Frame (View: Show: Frame)

Another option is to use the free Concave Hull App to draw a concave hull around the data points
- If you have not already installed the App, press F10 to open the App Center.
- Click the Search tab and search on Concave.
- Install the Concave Hull App.
The App takes XY input and outputs Concave Hull Xn and Concave Hull Yn. Use this XY data to define a Custom Boundary as outlined above.
Keywords:concave hull, convex hull, Custom Boundary, Data Boundary, Layer Boundary, interpolation, Contouring info