1.260 FAQ-1061 How to add break marker at the break region on the plot?
Add-Axis-Break-on-Plot
Last Update: 8/3/2020
When a break is added to the axis, the break region display as a gap on the plot by default.
To add the axis break marker to plot
- After adding the axis break, click on it and select Plot Break Symbol botton :
 on the mini toolbar that appears.
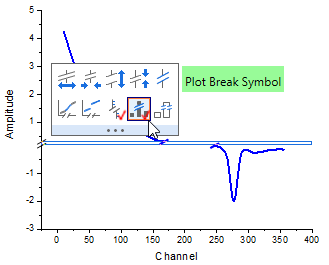
Note: The break marker symbol follows the shape of axis break and its color follows the plot's.
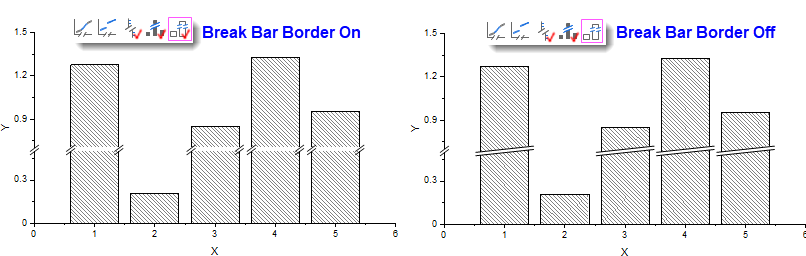
Especially for Column/Bar chart
- You can further select Break Bar Border button
 (next to Plot Break Symbol botton button) to plot the break marker at both borders. Otherwise, the marker will be plotted across the entire bar.
Keywords:axis break, gap, plot break marker, break region, break area